7 Insights on How Data Dashboards for Collectors Drive Better Recovery
Debt Collection & Recovery Software
7 Insights on How Data Dashboards for Collectors Drive Better Recovery
Published on:
August 3, 2026
Collection teams often work across disconnected systems, where payment data, outreach activity, and account status are never fully aligned. This makes it difficult to prioritize the right accounts at the right time, slowing recovery efforts. At the same time, the scale of the problem is growing.
According to the Federal Reserve Bank of New York, U.S. household debt reached$18.80 trillion in Q4 2025. When volumes rise, gaps in visibility become harder to manage. This is where data dashboards for collectors become critical. In this article, we break down seven benefits of how they help teams improve recovery outcomes.
Brief look:
Dashboards turn data into action. Real-time visibility helps teams prioritize accounts, time outreach, and act without delays.
Insights improve recovery decisions. Data reveals when consumers are most likely to pay and which strategies convert.
Unified systems reduce missed opportunities. Consolidating payments, interactions, and accounts eliminates gaps in execution.
Compliance becomes enforceable, not reactive. Tracking activity ensures rules are applied consistently across channels.
Scalable dashboards support consistent recovery. Agencies can manage larger portfolios without losing control or visibility.
What Are Data Dashboards for Collectors?
A data dashboard is a centralized interface that displays real-time and historical data in a structured, visual format. It brings together account activity, payment behavior, and performance metrics into a single view, allowing teams to monitor and act without switching systems.
Unlike static reports, dashboards are continuously updated, making them more useful for day-to-day decision-making. A typical collection dashboard includes:
Real-Time Data Feeds: Live updates on payments, account status, and interactions
Key Performance Metrics: Recovery rates, PTPs, and contact success rates
Account Segmentation Views: Breakdowns by risk level, balance, or delinquency stage
Channel Performance Tracking: Insights across calls, SMS, email, and self-service portals
Custom Filters and Drill-Downs: Ability to analyze specific accounts or trends
Audit and Activity Logs: Visibility into interactions for compliance and tracking
These components turn raw data into something teams can actually use. However, not all reporting systems offer this level of visibility or flexibility. In the next section, we look at how static reports limit recovery efforts in third-party debt collection.
Limitations of Static Reports in Third-Party Debt Collection
Static reports were built for periodic review, not real-time decision-making. In third-party collections, where timing, prioritization, and compliance all depend on up-to-date information, this creates clear operational gaps.
These are:
Delayed Data Availability: Reports are generated in batches, so teams act on outdated information rather than current account activity. This leads to missed payment windows and slower response times.
Fragmented Data Sources: Data is pulled from multiple systems, making it difficult to get a unified view of accounts, performance, and engagement. This creates inconsistencies and limits accurate decision-making.
Limited Actionability: Static reports show what happened, but do not support immediate action within the same system. Teams must switch tools to execute the next steps.
Reduced Visibility Into Performance: Key metrics are often aggregated and delayed, making it harder to identify underperforming strategies or agents in time.
Higher Compliance Risk: Without real-time tracking, it becomes harder to monitor call timing, frequency, and interaction history accurately. This increases the risk of violations.
Tratta delivers real-time dashboards combining payment activity, omnichannel engagement, and account data, with analytics that track performance across campaigns and portfolios. Embedded workflows connect insights directly to execution, enabling faster, in-system decision-making.Schedule a free demo today.
How Do Real-Time Dashboards Improve Third-Party Collections?
Real-timedashboards move collections from reactive reporting to active execution. By bringing live payment activity, engagement signals, and account data into a single view, they help teams act faster, prioritize more effectively, and reduce missed recovery opportunities.
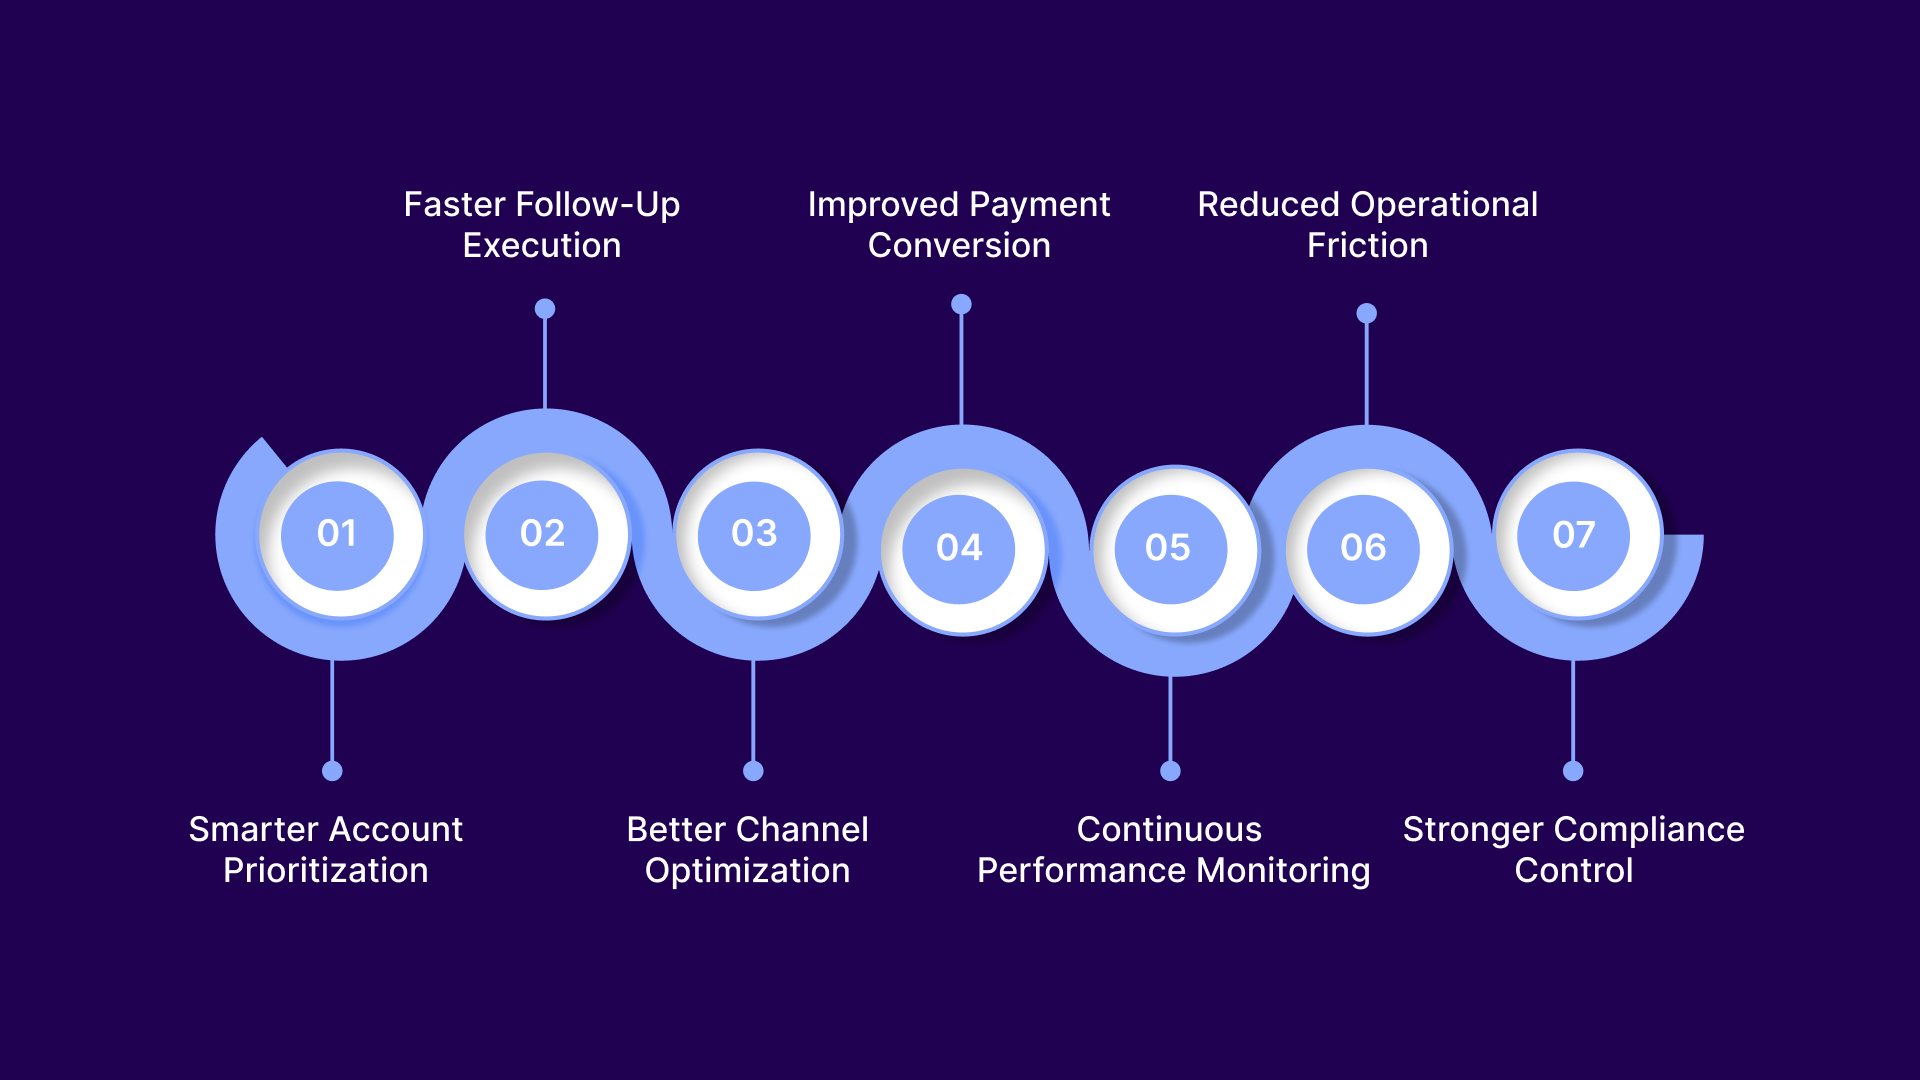
The benefits below show how this directly improves recovery outcomes for agencies, law firms, and debt buyers:
1. Smarter Account Prioritization
Real-time dashboards surface high-intent and high-value accounts as activity changes, allowing teams to focus effort where recovery is most likely.
What it includes
Dynamic segmentation based on recent activity
Real-time segmentation by balance, risk, or behavior
Flags for recent engagement or payments
Queue ordering based on configurable rules and segmentation logic.
Recovery impact
Agencies focus on accounts most likely to pay
Law firms prioritize active, high-value cases
Debt buyers improve yield from responsive segments
Teams reduce time spent on low-probability accounts
2. Faster Follow-Up Execution
Dashboards eliminate delays between consumer action and response, ensuring timely engagement during peak conversion windows.
What it includes
Instant updates on payments and interactions
Event-based alerts for account activity
Real-time task and queue updates
Trigger-based follow-up workflows
Recovery impact
Agencies act while intent is highest
Law firms reduce lag between actions
Debt buyers shorten recovery cycles
Teams prevent drop-offs after initial contact
3. Better Channel Optimization
Dashboards reveal which communication channels drive results across segments, allowing teams to refine outreach strategies.
What it includes
Channel-wise conversion tracking
Engagement patterns across SMS, calls, and email
Segment-level channel performance
Timing trends by channel
Recovery impact
Agencies invest in high-performing channels
Law firms tailor outreach by case type
Debt buyers improve channel ROI
Teams reduce ineffective communication
4. Improved Payment Conversion
Real-time visibility into payment activity helps teams act on high-intent signals and convert more accounts successfully.
What it includes
Tracking of partial payments and retries
Real-time payment status updates
Visibility into settlement activity
Payment behavior trends across accounts
Recovery impact
Agencies convert partial payments into full recovery
Law firms secure settlements faster
Debt buyers identify high-intent accounts
Teams increase overall recovery rates
5. Continuous Performance Monitoring
Dashboards track performance as it happens, allowing teams to identify issues and adjust strategies in real time, rather than relying on delayed reports and post-cycle analysis.
What it includes
Live recovery and conversion metrics
Agent-level performance tracking
Campaign performance visibility
Portfolio-level trend analysis
Recovery impact
Agencies correct underperformance early
Law firms monitor case-level progress
Debt buyers optimize strategies faster
Teams improve overall efficiency
6. Reduced Operational Friction
By consolidating data and actions into one interface, dashboards reduce reliance on multiple tools and manual processes.
What it includes
Unified view of accounts, payments, and communications
In-system execution of tasks and actions
Integrated workflows across functions
Reduced need for external reporting tools
Recovery impact
Agencies streamline operations
Law firms reduce coordination delays
Debt buyers process accounts faster
Teams spend more time on recovery, less on admin
7. Stronger Compliance Control
Dashboards provide visibility into communication and activity patterns, helping teams maintain consistent, compliant operations.
What it includes
Call timing and frequency tracking
Interaction logs across channels
Activity history per account
Audit-ready reporting views
Recovery impact
Agencies reduce regulatory risk
Law firms maintain defensible records
Debt buyers ensure compliant portfolio management
Teams avoid disruptions that impact recovery
Tratta brings these benefits into practice through event-driven workflows, integrated payment processing, and unified communication tracking. Its analytics layer supports real-time segmentation and performance monitoring, while audit-ready logs enable consistent, compliant execution across collections.Contact us to learn more.
Types of Data Dashboards Used in Debt Collection Operations
Different dashboards structure and present data in ways that support execution, analysis, and oversight at different levels. Understanding these types helps agencies interpret data correctly and apply it where it matters most.
Table showing common types of data dashboards:
Dashboard Type
Purpose
Where Used
Operational
Displays live, account-level data
Agent queues, daily collections
Performance
Aggregates KPIs and productivity metrics
Team management, agent oversight
Portfolio
Structures the data across segments and balances
Strategy, debt buyer decisions
Campaign
Organizes outreach and engagement data
SMS, email, and call campaigns
Payment
Visualizes transaction and settlement data
Payments, settlements
Compliance
Tracks communication and activity logs
Audit, regulatory oversight
Analytical
Combines historical and real-time data for trends
Strategy and optimization
Each dashboard type presents data differently depending on its purpose. They create a structured view of activity, performance, and risk. When used correctly, they help teams move from isolated data points to coordinated action. This ensures data is interpreted consistently across teams.
Key data perspectives include:
Real-time vs historical data views
Account-level vs portfolio-level aggregation
Channel-specific vs unified interaction data
Transactional vs behavioral data patterns
This structured view of data becomes critical in regulated environments. In the next section, we examine how data visibility directly supports compliance in collection operations.
The Link Between Data Visibility and Compliance in Collections
Compliance in collections depends on how consistently those rules are applied across accounts, channels, and timelines. Data visibility makes this possible by turning regulatory requirements into trackable, enforceable actions within daily operations.
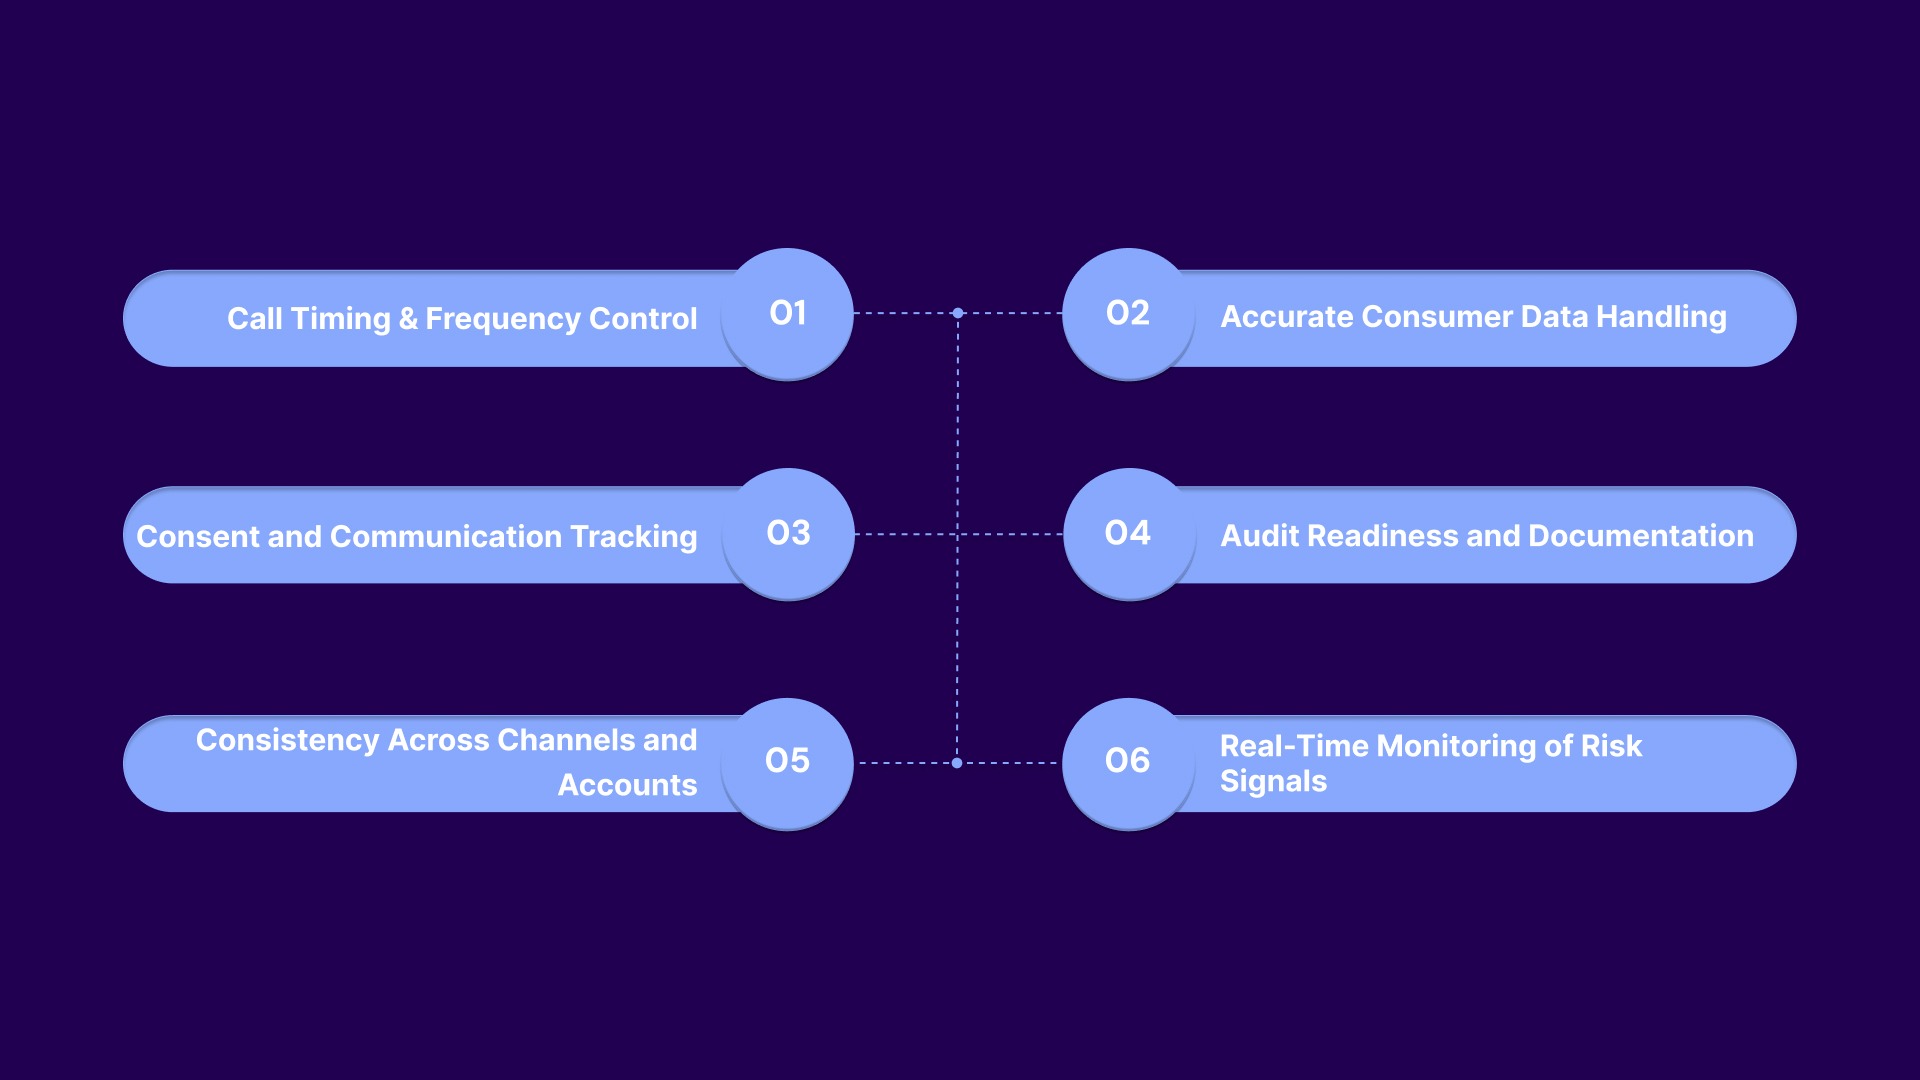
Key compliance controls enabled by data visibility:
Call Timing and Frequency Control (FDCPA) The Fair Debt Collection Practices Act restricts when consumers can be contacted and prohibits excessive or harassing communication patterns. Real-time dashboards track call attempts, timestamps, and frequency across accounts, helping teams avoid exceeding limits. This ensures outreach stays within legal windows and reduces the risk of violations tied to over-contact.
Accurate Consumer Data Handling (FCRA) The Fair Credit Reporting Act requires accurate reporting and handling of consumer credit information. Dashboards consolidate account data, payment updates, and dispute activity into a single view, reducing inconsistencies. This helps ensure that decisions and reporting are based on current, verified information.
Consent and Communication Tracking (TCPA) The Telephone Consumer Protection Act governs how consumers can be contacted, especially via calls and SMS. Dashboards track consent status, communication history, and opt-in/opt-out activity in real time. This helps agencies ensure that outreach is properly authorized and aligned with regulatory requirements.
Audit Readiness and Documentation (CFPB Oversight) The Consumer Financial Protection Bureau requires agencies to maintain clear records of consumer interactions. Dashboards provide audit trails with timestamps, interaction logs, and activity history across channels. This ensures agencies can demonstrate compliance during audits or disputes.
Consistency Across Channels and Accounts Regulations apply across all communication channels and not just calls. Dashboards unify data across SMS, email, calls, and payment portals, ensuring consistent application of rules. This reduces the risk of fragmented compliance where one channel follows rules while another does not.
Real-Time Monitoring of Risk Signals Compliance risks often emerge from patterns, such as repeated contact attempts or missed disclosures. Dashboards make these patterns visible as they happen, allowing teams to intervene before issues escalate. This shifts compliance from reactive correction to proactive control.
Without clear visibility, even well-defined compliance policies can break down in execution. Choosing the right data dashboard becomes critical to ensure that data is not only visible but also actionable across operations. In the next section, we examine how to evaluate dashboards that support both recovery performance and compliance.
How to Choose the Right Data Dashboard for Collection Operations
Choosing a dashboard requires selecting a system that turns data into consistent, real-time action across collections. The right dashboard should support both recovery performance and compliance without adding operational friction.
What to evaluate:
Segmentation and Prioritization: The system should support dynamic grouping based on behavior, balance, and engagement. This allows teams to focus on accounts with the highest recovery potential.
Omnichannel Tracking: Visibility across calls, SMS, email, and payment portals is essential. This ensures consistent communication and coordinated outreach.
Compliance Controls: Built-in tracking of call timing, frequency, and interaction logs helps enforce regulatory requirements. This supports audit readiness and reduces risk.
Scalability and Performance: The dashboard should handle large portfolios without slowing down or losing visibility. This is critical for agencies managing high volumes.
Historical and Trend Analysis: Beyond real-time data, dashboards should allow comparison over time. This helps identify what strategies are improving or hurting recovery.
When visibility, workflows, and compliance controls operate within the same system, teams can prioritize accounts accurately, execute without delay, and maintain consistency across portfolios. Without that alignment, even strong data fails to translate into better recovery outcomes.
Conclusion
A poorly designed dashboard does more harm than good. When data is delayed, fragmented, or disconnected from execution, teams rely on guesswork instead of signals. This leads to missed follow-ups, inconsistent outreach, and compliance gaps that directly impact recovery outcomes.
Tratta addresses these challenges by combining real-time visibility with execution. It supports dynamic segmentation and prioritization, tracks interactions across calls, SMS, email, and payment portals, and maintains audit-ready logs for compliance. With scalable performance and historical analytics, teams can manage large portfolios while continuously refining recovery strategies.
See how your current dashboards are performing. Identify where delays, gaps, or inconsistencies are affecting recovery. Request a free demo today.
Frequently Asked Questions
1. How do data dashboards for collectors support dispute management?
They provide a centralized view of disputes, supporting documentation, and interaction history. This helps agencies track resolution timelines, ensure accurate handling, and maintain records needed for compliance and audit purposes.
2. Can dashboards help improve agent training and onboarding?
Yes, dashboards highlight performance trends, common errors, and successful behaviors. Managers can use this data to train agents more effectively and standardize best practices across teams.
3. How do dashboards support multi-portfolio management for debt buyers?
Dashboards allow segmentation and tracking across multiple portfolios in one interface. This helps debt buyers compare performance, allocate resources, and adjust strategies based on portfolio-level outcomes.
4. What role do dashboards play in managing settlement strategies?
They provide visibility into settlement patterns, acceptance rates, and payment behavior. This helps agencies refine offers and identify which strategies lead to higher recovery rates.
5. Are dashboards useful for long-term recovery planning?
Yes, historical reporting and trend analysis help agencies understand performance over time. This supports better forecasting, resource planning, and strategy development across collection cycles.
Note: This information is not legal advice. Tratta recommends that you consult with your legal counsel to make sure that you comply with applicable laws in connection with your collection and outreach activities.
Sign up for our monthly newsletter
Debt collection insights that keep you compliant and competitive.
Thank you! Your submission has been received!
Oops! Something went wrong while submitting the form.